GeleeGelee
PricingBlog

Analytics & Reporting

First touch to booked call. Tracked.

Every message, every post, every meeting — connected to revenue. Outreach analytics, post performance, industry benchmarks, and executive dashboards for teams.

Outreach funnel attributionPost performance + engagementIndustry benchmarksExecutive cross-account dashboards
Get started →

How it works

From nothing to meetings booked.

1. Auto-tracked from day 1

No setup. Every message, post, and meeting is attributed automatically — from connection send to reply to DM thread to calendar booking.

2. Weekly + monthly reports

Weekly snapshot lands in your inbox every Monday. Monthly deep-dive shows what's working, what changed, and what to double down on.

3. Executive + client views

Scale plans get cross-account executive dashboards and client-facing branded reports. Agencies stop building PowerPoints.

Know what's actually booking meetings

Every connection, every message, every reply, every meeting — attributed end-to-end. Know which sequences, which hooks, which ICP segments, which days-of-week drive pipeline. Stop running campaigns that don't work because nobody could tell they weren't working.

web.gelee.ai
Outreach analytics

Benchmarked against your industry

Your reply rate vs. the median SaaS founder. Your post engagement vs. your peer group. Your meeting book rate vs. top quartile. Built-in benchmarks mean coaching conversations and strategy decisions backed by data, not vibes. 50+ clients contribute to the benchmarks so they're real.

web.gelee.ai
Industry benchmarks

Executive dashboards for teams

Managing reps? The cross-account dashboard shows who's posting, who's booking, and who needs help — at a glance, no spreadsheet exports. Custom client-facing reports on the Scale plan for agencies; branded PDFs generated monthly per client.

web.gelee.ai
Team dashboard

What's included

Everything you get with Analytics & Reporting.

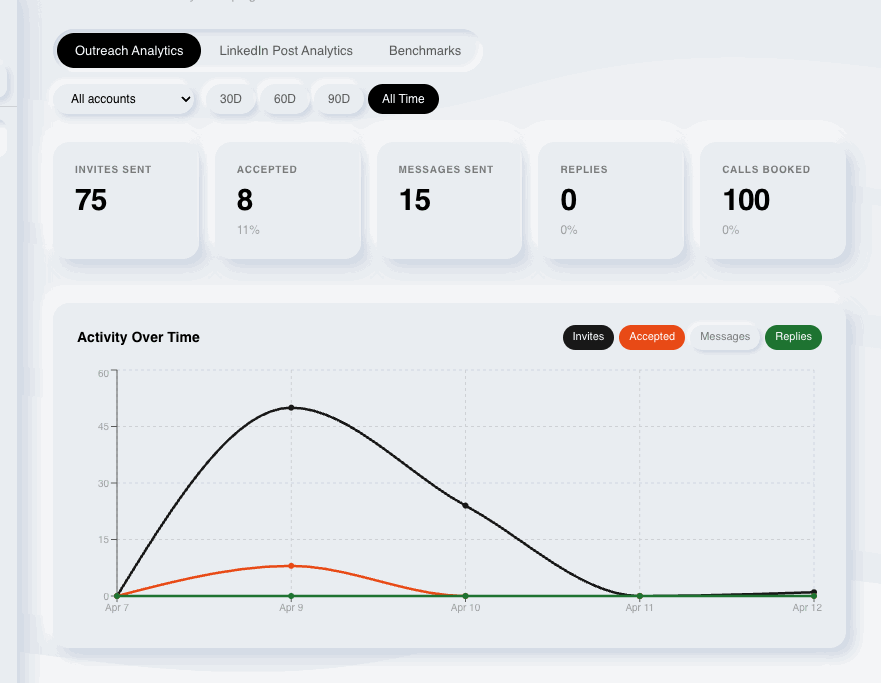
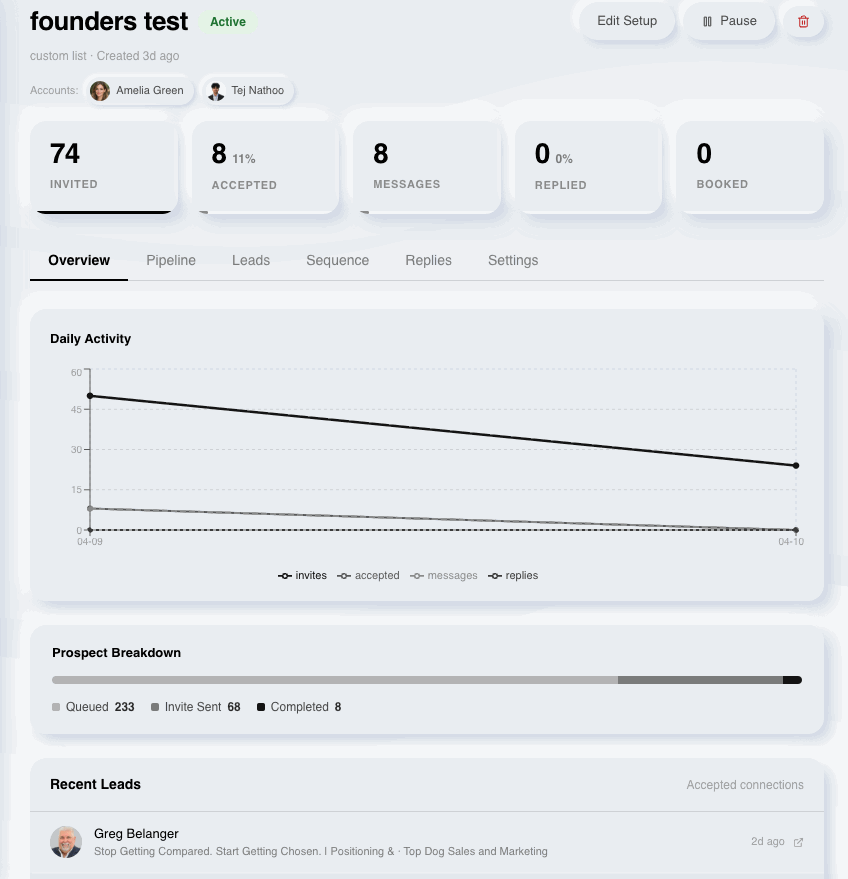
End-to-end funnel attribution

Post performance (impressions, reactions, comments, DMs)

Reply rate, meeting rate, show rate

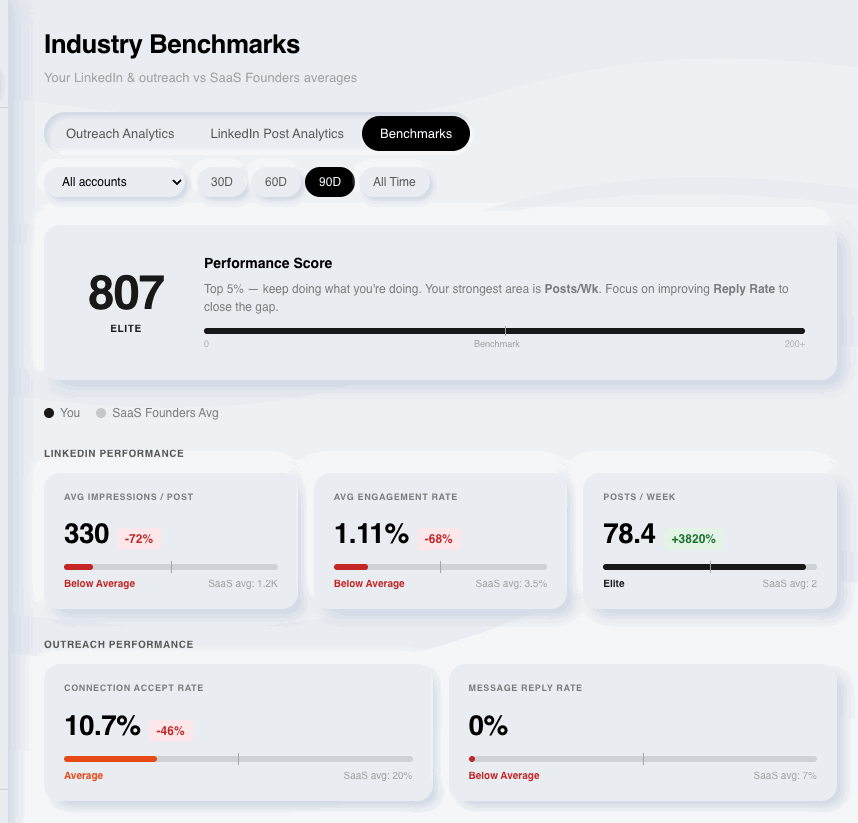
Industry benchmarks (SaaS, agency, sales, etc.)

Weekly email digest

Monthly deep-dive report

Cross-account executive view (Growth+)

Custom client-facing reports (Scale)

Questions

Analytics & Reporting FAQs.

Does this replace my BI stack?+

For LinkedIn-sourced pipeline, yes. We don't try to replace Salesforce or HubSpot — we feed them. Integrations push attribution data into your CRM on Growth and Scale.

How are benchmarks calculated?+

Aggregated across 50+ clients, segmented by industry, ICP, and plan. Updated monthly. You see your percentile at a glance.

Can I export raw data?+

Yes. CSV export on every view. API access on Scale for pushing into your warehouse.

Does it track show rate, not just book rate?+

Yes. Calendar integration pulls whether the meeting happened. Show rate, no-show rate, and reschedule rate all tracked.

Everything. One place.

No BI tools to build. No analyst to hire. The whole funnel, tracked and benchmarked on day one.

Analytics & Reporting

See what's working. Do more of it.

Every post, DM, and meeting — tracked end-to-end.

Get started →Book a demo